Understanding the characteristics of disk performance of a platform might be more important than you think. If disk resources are not correctly matched to your workload, your performance will suffer and might lead you to incorrectly diagnose a problem as being related to CPU or memory.
The defaults might also not give you the performance you expect.
In this first post on troubleshooting some disk performance issues on Azure Kubernetes Service (AKS) we will benchmark Azure Premium SSD to find how workloads affect performance and which metrics to monitor to know when troubleshooting potential disk issues.
TLDR:
- Disable Azure cache for workloads with high number of random writes
- Use a P15 (256GB) or larger Premium SSD even though you might only need a fraction of it.
Table of contents
- Background
- What to measure?
- How to measure disk
- How to measure disk on Azure Kubernetes Service
- Test results
- Conclusion
Microsoft Azure
If you don’t have a Azure subscription already you can try services for $200 for 30 days. The VM size Standard_B2s is Burstable, has 2vCPU, 4GB RAM, 8GB temp storage and costs roughly $38 / month. For $200 you can have a cluster of 3-4 B2s nodes plus traffic, loadbalancers and other additional costs.
See my blog post Managed Kubernetes on Microsoft Azure (English) for information on how to get up and running with Kubernetes on Azure.
I have no affiliation with Microsoft Azure except using them through work.
Corrections
February 2020: Some of my previous knowledge and assumptions were not correct when applied to a cloud + Docker environment, as explained by AKS PM Jesse Noller on GitHub.
One of the issues is that even accessing a “data disk” will incur IOPS on the OS disk, and throttling of the OS disk will also constraint IOPS on the data disks.
Background
I’m part of a team at Equinor building an internal PaaS based on Kubernetes running on AKS (Azure managed Kubernetes). We use Prometheus for monitoring each cluster as well as InfluxDB for collecting metrics from k6io which runs continous tests on our public endpoints.
A couple of weeks ago we discovered some potential problems with both Prometheus and InfluxDB with memory usage and restarts. High CPU usage of type iowait suggested that there might be some disk issues contributing to the problems.
iowait: “Percentage of time that the CPU or CPUs were idle during which the system had an outstanding disk I/O request.” (hpe.com). You can see
iowaiton your Linux system by runningtopand looking at thewapercentage.PS: You can have a disk IO bottleneck even with low
iowait, and a highiowaitdoes not always indicate a disk IO bottleneck (ibm.com).
First off we need to benchmark the underlying disk to get an understanding of it’s performance limits and characteristics. That is what we will cover in this post.
Metric Methodologies
There are two helpful methodologies when monitoring information systems. The first one is Utilization, Saturation and Errors (USE) from Brendan Gregg and the second one is Rate, Errors, Duration (RED) from Tom Wilkie. RED is best suited when observing workloads and transactions while USE is best suited for observing resources.
I’ll be using the USE method here. USE can be summarised as:
- For every resource, check utilization, saturation, and errors.
- resource: all physical server functional components (CPUs, disks, busses, …)
- utilization: the average time that the resource was busy servicing work
- saturation: the degree to which the resource has extra work which it can’t service, often queued
- errors: the count of error events
Storage Background
Disk usage has two dimensions, throughput/bandwidth(BW) and operations per second (IOPS), and the underlying storage system will have upper limits of how much data it can receive (BW) and the number of operations it can perform per second (IOPS).
Background - harddrive types: harddrives come in two types, Solid State Disks (SSD) and spindle (HDD). A SSD disk is a microship capable of permanently storing data while a HDD uses spinning platters to store data. HDDs have a fixed rate of rotation (RPM), typically 5.400 and 7.200 RPM for lower cost drives for home use and higher cost 10.000 and 15.000 RPM drives for server use. Over the last 20 years of HDDs their storage density has increased, but the RPM has largely stayed the same. A disk with twice the density (500GB to 1TB for example) can read twice as much data on a single rotation and thus increase the bandwidth significantly. However, reading or writing a random block still requires waiting for the disk to spin enough to reach the relevant sector on the disk. So IOPS has not increased much for HDDs and is still a low 125-150 IOPS for a 10.000 RPM enterprise disk. A SSD does not have any moving parts so is able to reach MUCH higher IOPS. A low end Samsung 960 EVO with 500GB capacity costs $150 and can achieve a whopping 330.000 IOPS! (wikipedia.com)
Background - access patterns: The way a program uses storage also has a huge impact on the performance one can achieve. Sequential access is when we read or write a large file. When this happens the operating system and harddrive can optimize and “merge” operations so that we can read or write a much bigger chunk of data at a time. If we can read 1MB at a time 150 times per second we get 150MB/s of bandwidth. However, fully random access where the smallest chunk we read or write is a 4KB block the same 150 IOPS would only give a bandwidth of 0.6MB/s!
Background - cloud vs physical: Now we know what HDDs are limited to a low IOPS and low IOPS combined with a random access pattern gives us a low overall bandwidth. There is a huge gotcha here when it comes to cloud. On Azure when using Premium Managed SSD the IOPS you are given is a factor of the disk size you provision (microsoft.com). A 512GB disk is limited to 2.300 IOPS and 150MB/s. With 100% random access that only gives about 9MB/s of bandwidth!
Background - OS caching: To overcome some of the limitations of the underlying disk (mostly IOPS) there are potentially several layers of caching involved. Linux file systems can have
writebackenabled which causes Linux to temporarily store data that is going to be written to disk in memory. This can give a big performance increase when there are sudden spikes of writes exceeding the performance of the underlying disk. It also increases the chance that operations can bemergedwhere several write operations to areas of the disk that are nearby can be executed as one. This caching works best for sudden peaks and will not necessarily be enough if there is continous random writes to disk. This caching also means that even though an application thinks it has saved some data to disk it can be lost in the case of a power outage or other failure. Applications can also explicitly requestdirectaccess where every operation is persisted to disk before receiving a confirmation. This is a trade-off between performance and durability that needs to be decided based on the application itself and the environment.
Background - Azure caching: Azure also provides read and write cache for its
diskswhich is enabled by default. As we will see soon for our use case it’s not a good idea to use.
What to measure?
These metrics are collected by the Prometheus
node-exporterand follows it’s naming. I’ve also created a dashboard that is available on Grafana.com.
With the USE methodology as a guideline and the two separate but related “resources”, bandwidth and IOPS we can look for some useful metrics.
Utilization:
rate(node_disk_written_bytes_total)- Write bandwidth. The maximum is given by Azure and is 25MB/s for our disk size.rate(node_disk_writes_completed_total)- Write operations. The maximum is given by Azure and is 120 IOPS for our disk size.rate(node_disk_io_time_seconds_total)- Disk active time in percent. The time the disk was busy servicing requests. 100% means fully utilized.
Saturation:
rate(node_cpu_seconds_total{mode="iowait"}- CPU iowait. The percentage of time a CPU core is blocked from doing useful work because it’s waiting for an IO operation to complete (typically disk, but can also be network).
Useful calculated metrics:
rate(node_disk_write_time_seconds_total) / rate(node_disk_writes_completed_total)- Write latency. How long from a write is requested until it’s completed.rate(node_disk_written_bytes_total) / rate(node_disk_writes_completed_total)- Write size. How big the average write operation is. 4KB is minimum and indicates 100% random access while 512KB is maximum and indicates sequential access.
How to measure disk
The best tool for measuring disk performance is fio, even though it might seem a bit intimidating at first due to it’s insane number of options.
Installing fio on Ubuntu:
apt-get install fio
fio executes jobs described in a file. Here is the top of our jobs file:
[global]
ioengine=libaio   # sync|libaio|mmap
group_reporting
thread
size=10g          # Size of test file
cpus_allowed=1    # Only use this CPU core
runtime=300s      # Run test for 5 minutes

[test1]
filename=/tmp/fio-test-file
direct=1          # If value is true, use non-buffered I/O. Non-buffered I/O usually means O_DIRECT
readwrite=write   # read|write|randread|randwrite|readwrite|randrw
iodepth=1         # How many operations to queue to the disk
blocksize=4k
The fields we will be changing for the various tests are direct, readwrite, iodepth and blocksize. Save the contents in a file named jobs.fio and we run a test with fio --sector test1 jobs.fio and wait until the test completes.
PS: To run these tests on higher performance hardware and better caching you might want to set
runtimeto0to have the test run continously and monitor the metrics until performance reaches a steady-state.
How to measure disk on Azure Kubernetes Service
For this testing we use a standard Prometheus installation collecting data from node-exporter and visualizing data in Grafana. The dashboard I created for the testing can be found here: https://grafana.com/dashboards/9852.
By default Kubernetes will schedule a Pod to any node that has enough memory and CPU for our workload. Since one of the tests we are going to run are on the OS disk we do not want the Pod to run on the same node as any other disk-intensive application, such as Prometheus.
Look at which Pods are running with kubectl get pods -o wide and look for a node that does not have any disk-intensive application.
Then we tag that node with kubectl label nodes aks-nodepool1-37707184-2 tag=disktest. This allows us later to specify that we want to run our testing Pod on that specific node.
A StorageClass in Kubernetes is a specification of a underlying disk that Pods can request usage of through volumeClaimTemplates. AKS comes with a default StorageClass managed-premium that has caching enabled. Most of these tests require the Azure cache disabled so create a new StorageClass managed-premium-retain-nocache:
kind: StorageClass
apiVersion: storage.k8s.io/v1
metadata:
  name: managed-premium-retain-nocache
provisioner: kubernetes.io/azure-disk
reclaimPolicy: Retain
parameters:
  storageaccounttype: Premium_LRS
  kind: Managed
  cachingmode: None
You can add it to your cluster with:
kubectl apply -f https://raw.githubusercontent.com/StianOvrevage/stian.tech/master/images/2019-02-23-disk-performance-on-aks-part-1/storageclass.yaml
Next we create a StatefulSet that uses a volumeClaimTemplate to request a 250GB Azure disk. This provisions a P15 Azure Premium SSD with 125MB/s bandwidth and 1100 IOPS:
kubectl apply -f https://raw.githubusercontent.com/StianOvrevage/stian.tech/master/images/2019-02-23-disk-performance-on-aks-part-1/ubuntu-statefulset.yaml
Follow the progress of the Pod creation with kubectl get pods -w and wait until it is Running.
When the Pod is Running we can start a shell on it with kubectl exec -it disk-test-0 bash
Once inside bash on the Pod, we install fio:
apt-get update && apt-get install -y fio wget
And save the contents of in the Pod:
wget https://raw.githubusercontent.com/StianOvrevage/stian.tech/master/images/2019-02-23-disk-performance-on-aks-part-1/jobs.fio
Now we can run the different test sections one by one. PS: If you don’t specify a section fio will run all the tests simultaneously, which is not what we want.
fio --section=test1 jobs.fio
fio --section=test2 jobs.fio
fio --section=test3 jobs.fio
fio --section=test4 jobs.fio
fio --section=test5 jobs.fio
fio --section=test6 jobs.fio
fio --section=test7 jobs.fio
fio --section=test8 jobs.fio
fio --section=test9 jobs.fio
Test results
Test 1 - Learning to dislike Azure Cache
Sequential write, 4K block size, Azure Cache enabled, OS cache disabled. See full fio test results.
I run the first tests on the OS disk of a Kubernetes node. The OS disks have Azure caching enabled.
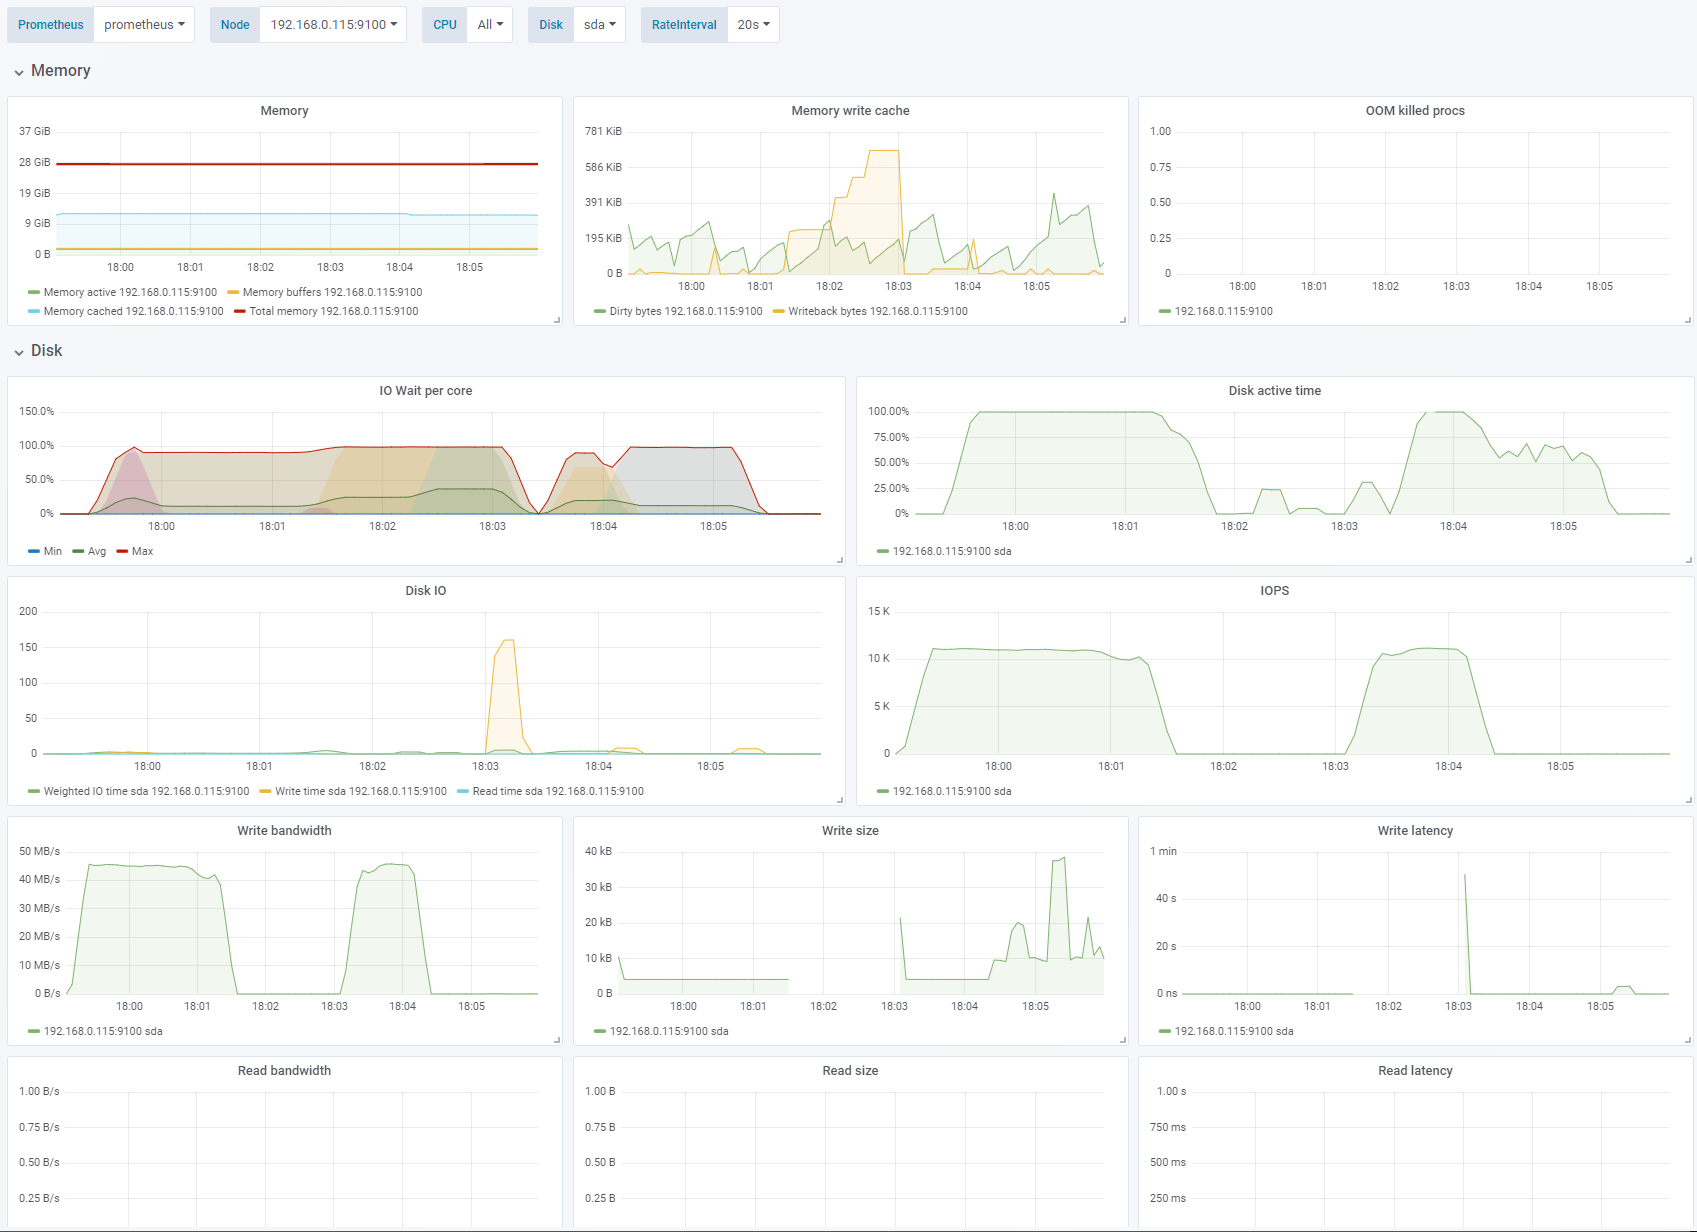
The first 1-2 minutes of the test I get very good performance of 45MB/s and ~11.500 IOPS but that drops to 0 very quickly as the cache is full and busy writing things to the underlying disk. When that happens everything freezes and I cannot even execute shell commands. After stopping the test the system still hangs for a bit while the cache empties.
The maximum latency measured by fio was 108751k usec. Or about 108 seconds!
For the first try of these tests a 20-30 second period of very fast writes (250MB/s) caused a 7-8 minutes hang while the cache emptied. Trying again caused another pattern of lower peak performance with shorter hangs in between. Very unpredictable. I’m not sure what to make of this. It’s not acceptable that a Kubernetes node becomes unresponsive for many minutes following a short burst of writing. There are scattered recommendations online of disabling caching for write-heavy applications. Since I have not found any way to measure the Azure cache itself, the results are unpredictable and potentially very impactful as well as making it very hard to use the metrics we do have to evaluate application and storage behaviour I’ve concluded that it’s best to use data disks with caching disabled for our workloads (you cannot disable caching on an AKS node OS disk).
Test 2 - Disable Azure Cache - enable OS cache
Sequential write, 4K block size. Change: Azure cache disabled, OS caching enabled. See full fio test results.
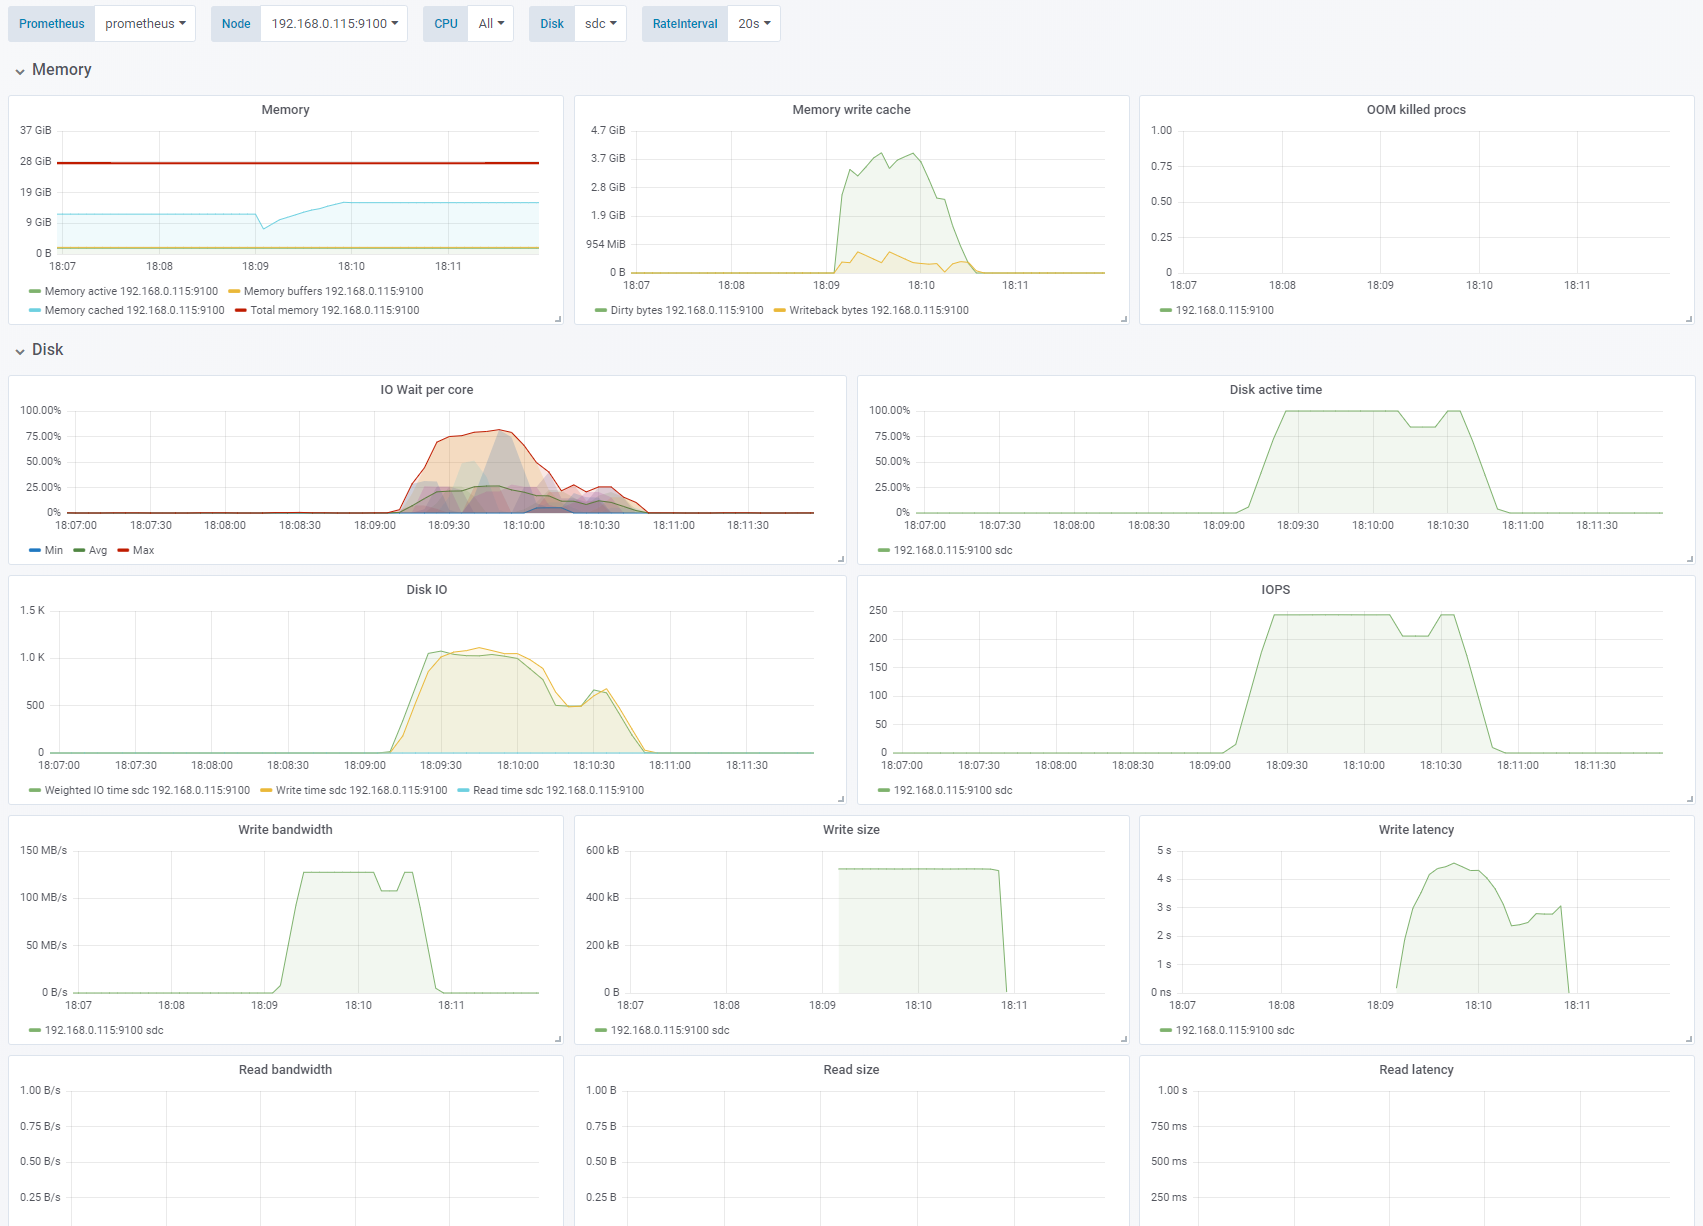
If we swap the Azure cache for the Linux OS cache we see that iowait increases while the writing occurs. The application sees high write performance until the number of Dirty bytes reaches a threshold of about 3.7GB of memory. The performance of the underlying disk is 125MB/s and 250 IOPS. Here we are throttled by the 125MB/s limit of the Azure P15 Premium SSD.
Also notice that on sequential writes of 4K with OS caching the actual blocks written to disk is 512K which saves us a lot of IOPS. This will become important later.
Test 3 - Disable OS cache
Sequential write, 4K block size. Change: OS caching disabled. See full fio test results.
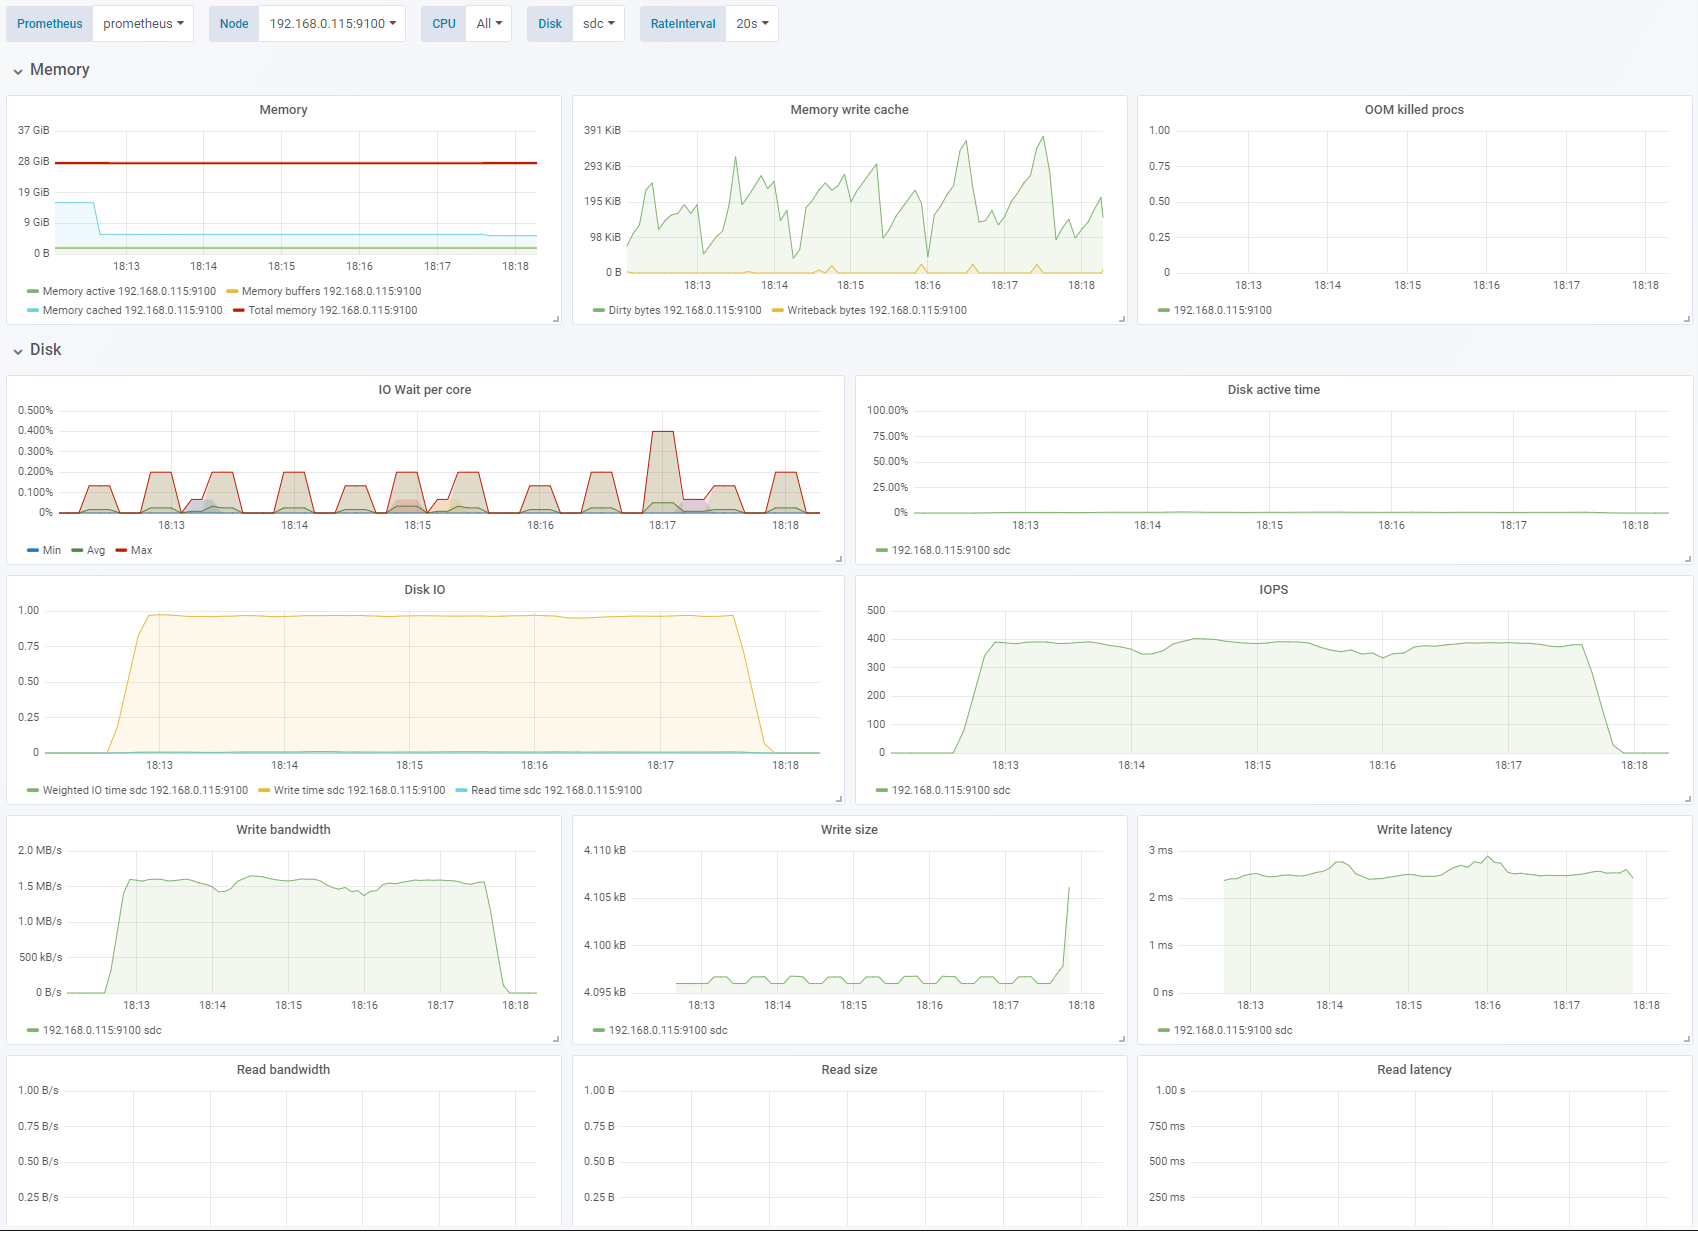
By disabling the OS cache (
direct=1) the results are consistent and predictable. There is noiowaitsince the application does not have multiple writes pending at the same time. Because of the 2-3ms latency of the disks we are not able to get more than about 400 IOPS. This gives us a meager 1.5MB/s even though the disk is limited to 1100 IOPS and 125MB/s. To reach that we need multiple simultaneous writes or a bigger IO depth (queue).Disk active timeis also 0% which indicates that the disk is not saturated.
Test 4 - Increase IO depth
Sequential write, 4K block size, OS caching disabled. Change: IO depth 16. See full fio test results.
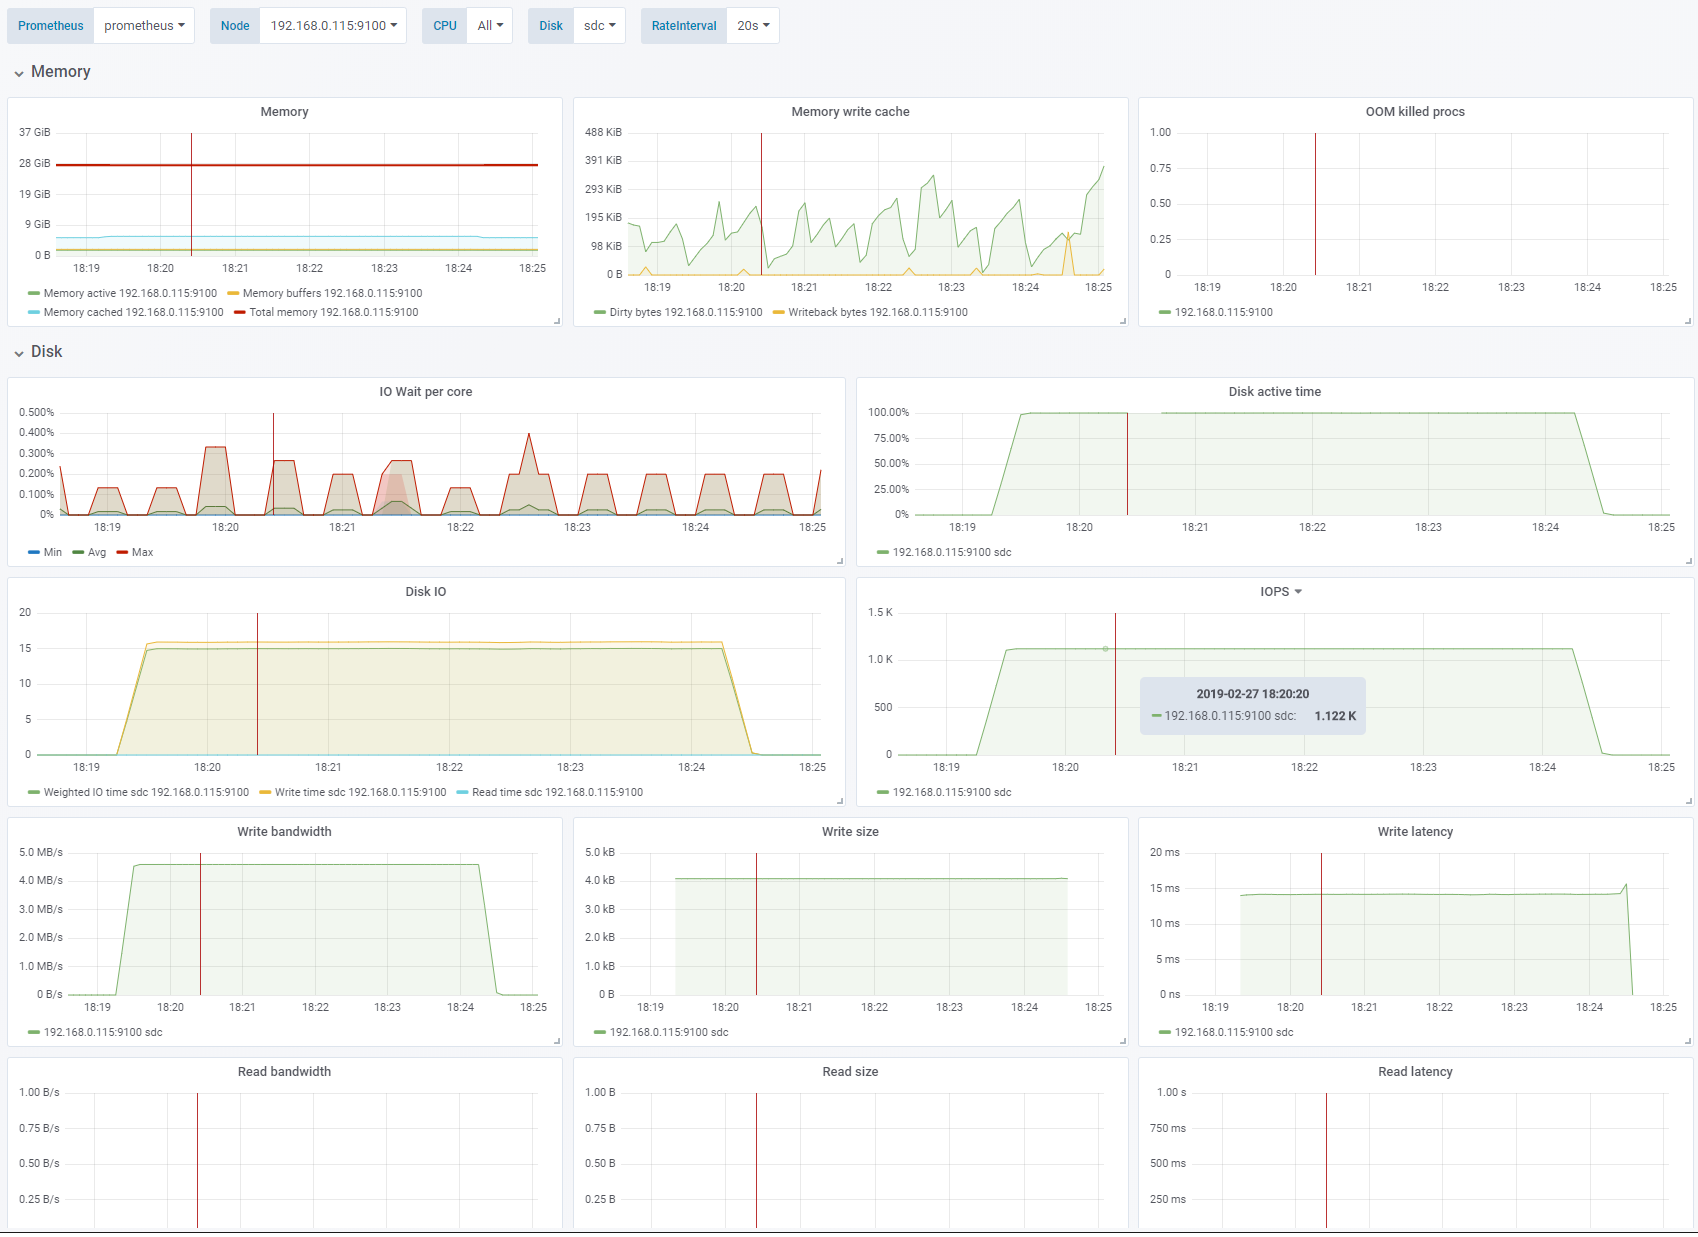
For this test we only increase the IO depth from 1 to 16. IO depth is the number of write operations
fiowill execute simultaneously. Since we are usingdirectthese will be queued by the OS for writing. We are now able to hit the performance limit of 1100 IOPS.Disk active timeis now steady at 100% indicating that we have saturated the disk.
Test 5 - Larger block size, smaller IO depth
Sequential write, OS caching disabled. Change: 128K block size, IO depth 1. See full fio test results.
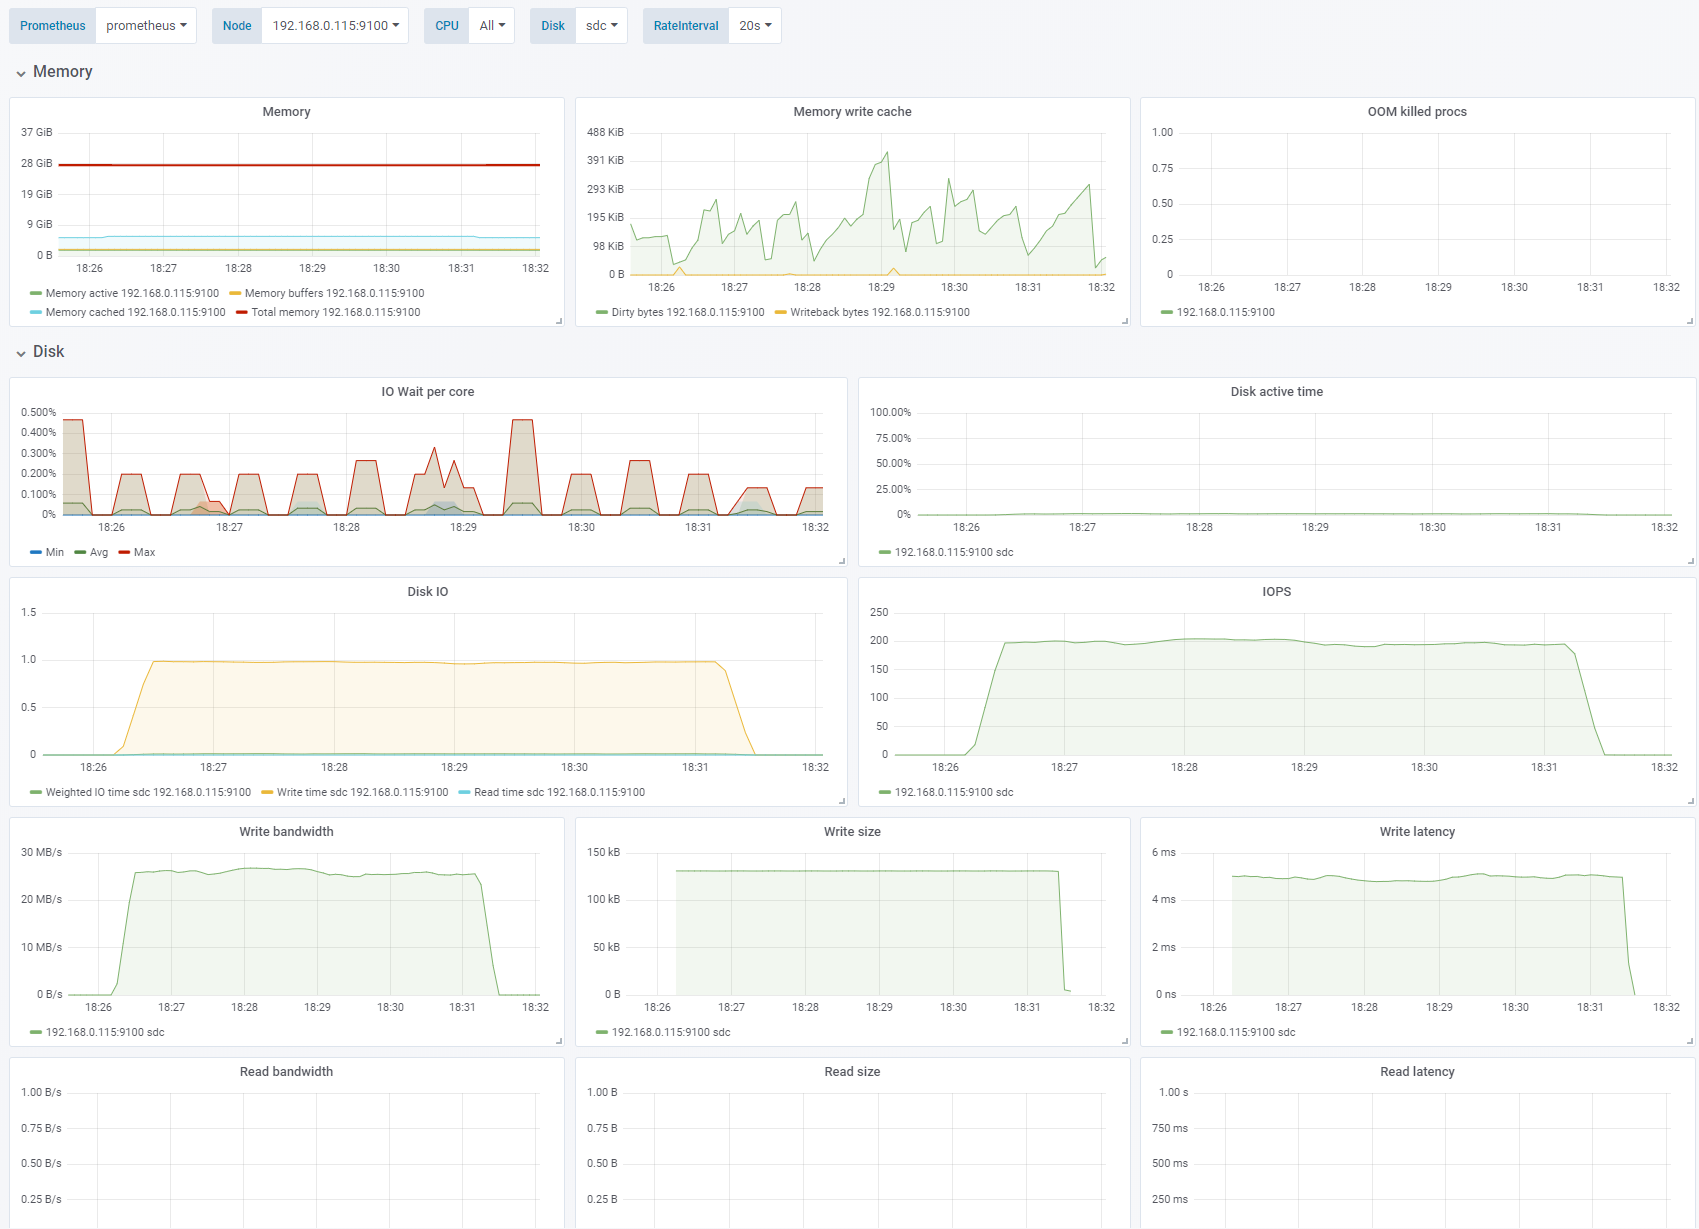
We increase the block size to 128KB and reduce the IO depth to 1 again. The write latency for larger blocks increase to ~5ms which gives us 200 IOPS and 28MB/s. The disk is not saturated.
Test 6 - Enable OS cache
Sequential write, 256K block size, IO depth 1. Change: OS caching enabled. See full fio test results.
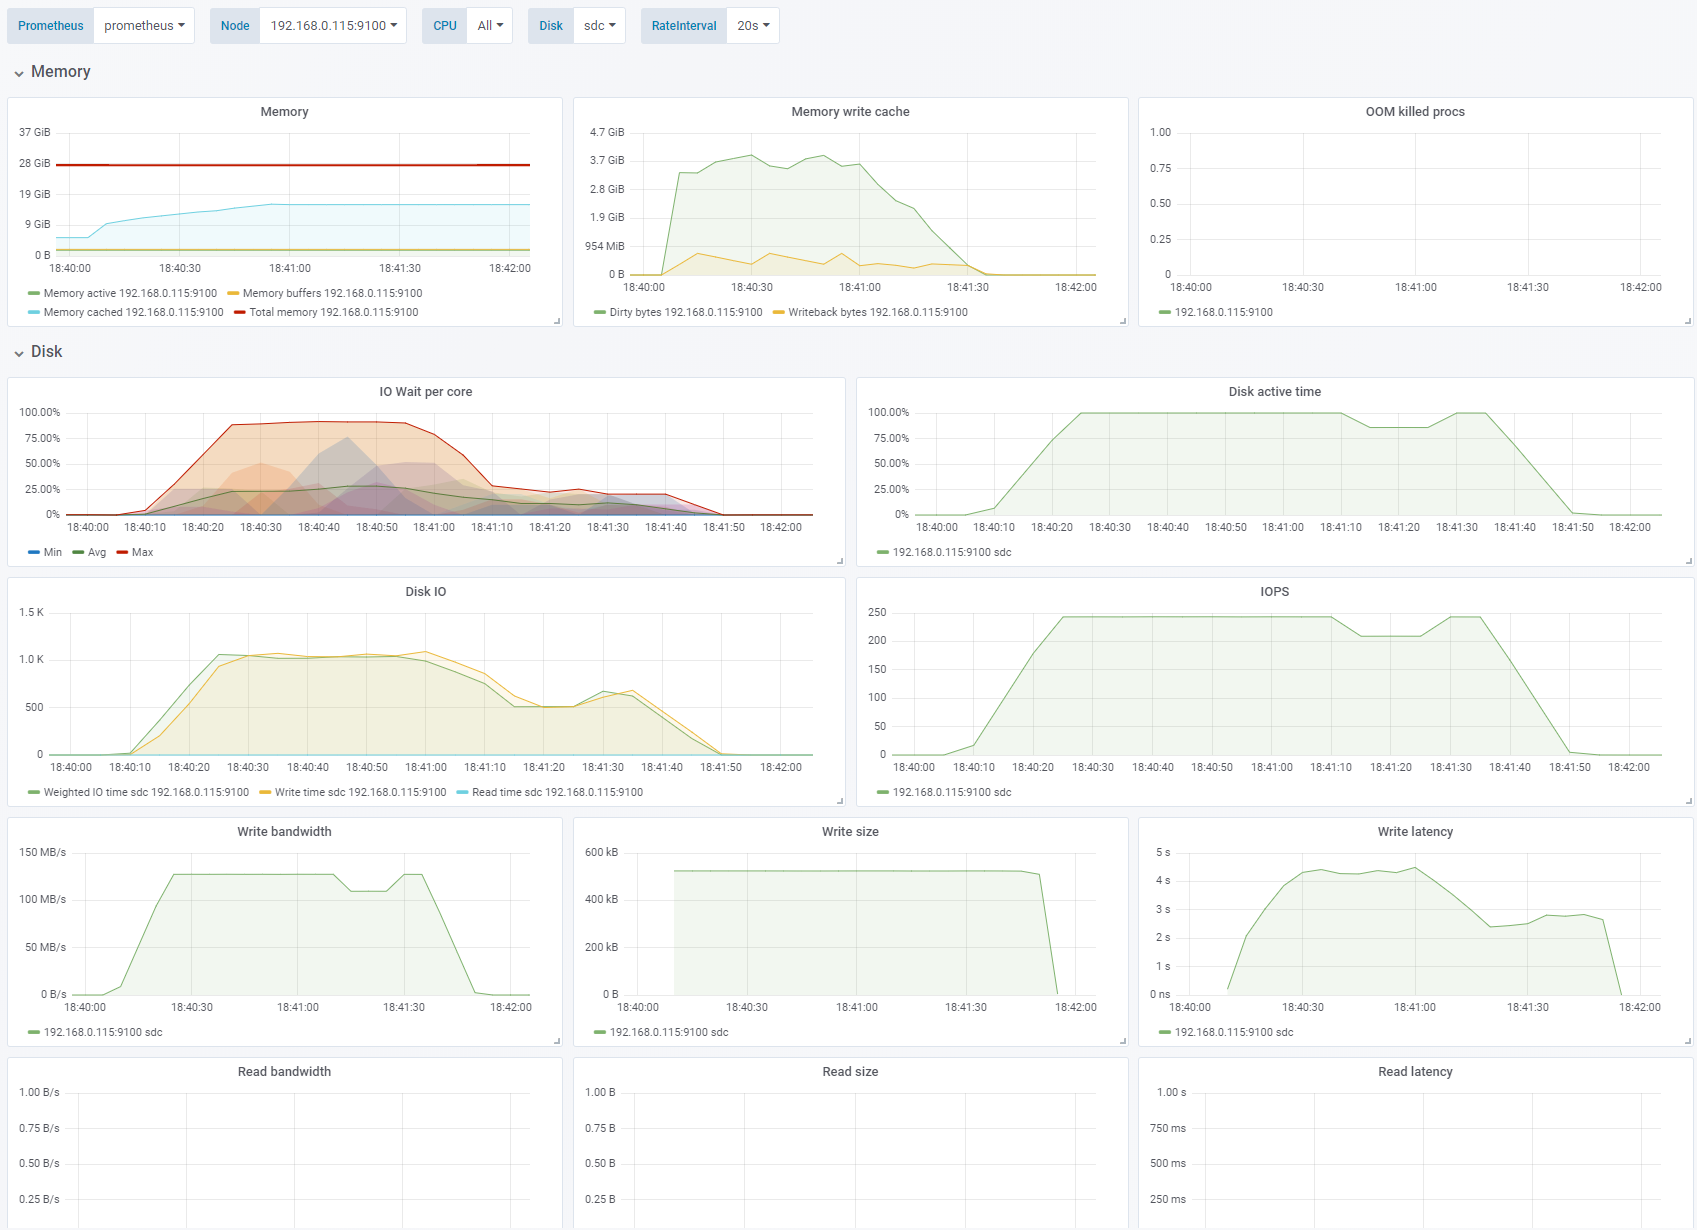
We have now enabled the OS cache/buffer (
direct=0). We can see that the writes hitting the disk are now merged to 512KB blocks. We are hitting the 125MB/s limit with about 250 IOPS. Enabling the cache also has other effects: CPU suddenly shows significant IO wait. The write latency shoots through the roof. Also note that the writing continued for 30-40 seconds after the test was done. This also means that the bandwidth and IOPS thatfiosees and reports is higher than what is actually hitting the disk.
Test 7 - Random writes, small block size
IO depth 1, OS caching enabled. Change: Random write, 4K block size. See full fio test results.
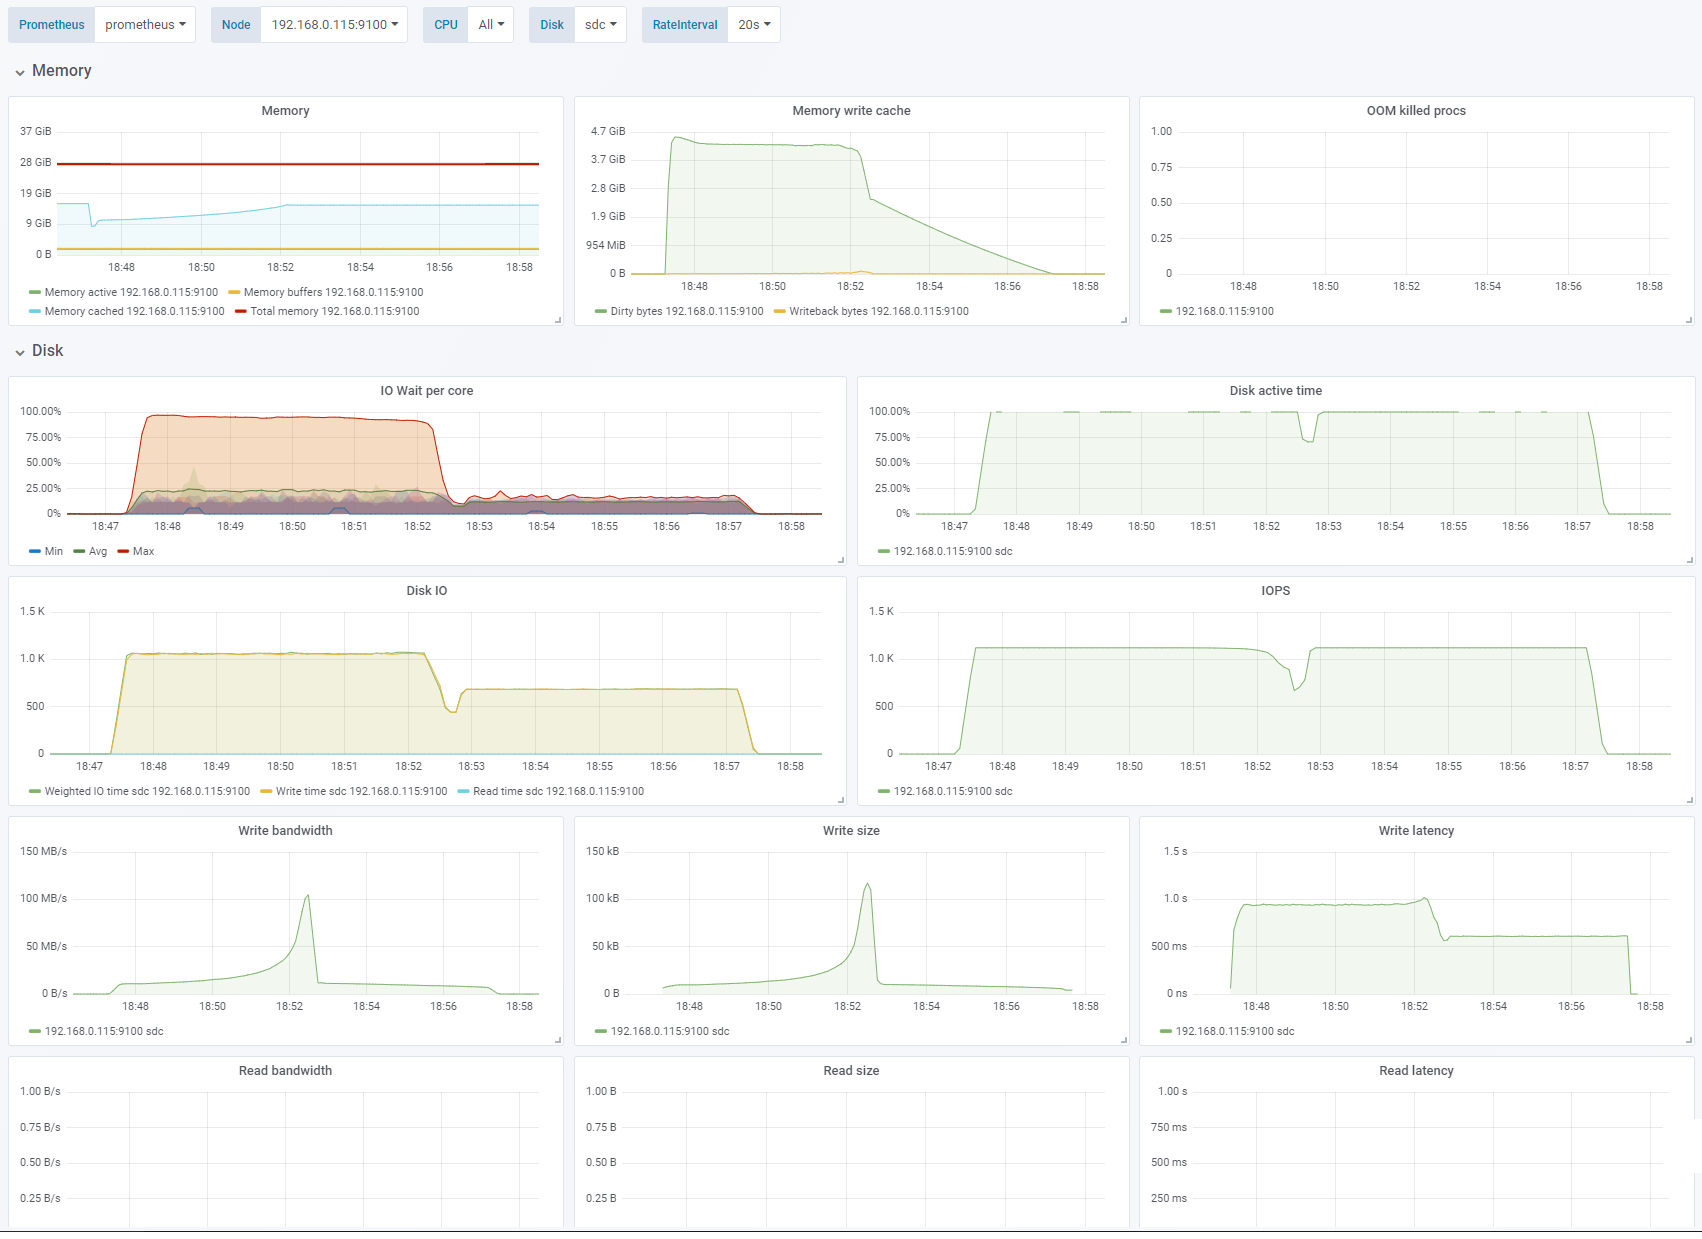
Here we go from sequential writes to random writes. We are limited by IOPS. The average size of the blocks actually written to disks, and the IOPS required to hit the bandwidth limit is actually varying a bit throughout the test. The time taken to empty the cache is about as long as I ran the test (4-5 minutes).
Test 8 - Large block size
Random write, OS caching enabled. Change: 256K block size, IO depth 16. See full fio test results.
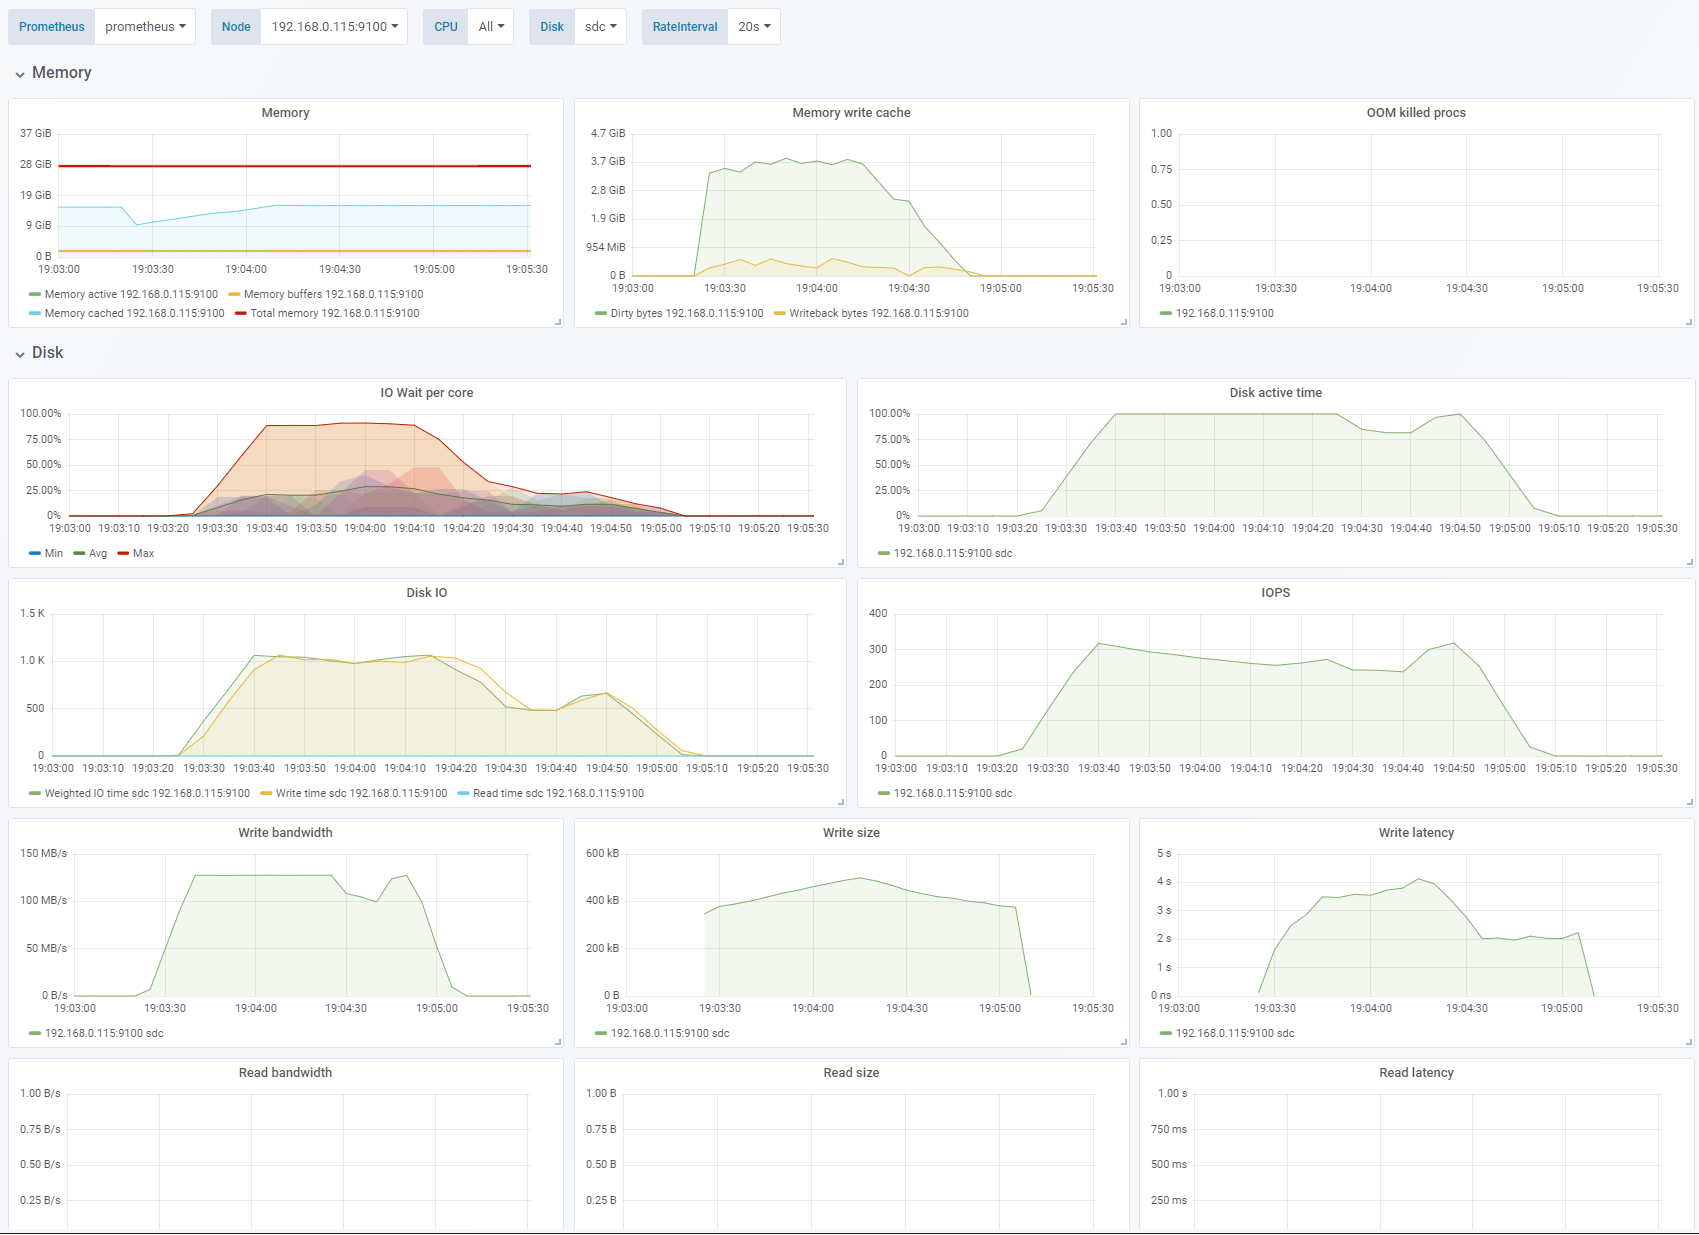
Increasing the block size to 256K makes us bandwidth limited to 125MB/s.
Conclusion
Access patterns and block sizes have a tremendous impact on the amount of data we are able to write to disk.
